

The Nonlinear Math Behind Winner–Take–All, with Duverger’s Law
Winner–Take–All’s Hidden Math — From S-Curve Amplification to Strategic Coordination

Researched with AI assistance—which means this document improves as readers verify and correct. Find an error? Let me know. This is living documentation.
Thesis
Small popular‑vote edges become large seat edges in single‑member, Winner–Take–All (WTA) elections because the Seat–Vote Relationship is nonlinear. Around 50–50, the system is highly responsive—one vote‑point can move several seat‑points—producing “supermajorities from razor‑thin votes.” [1, 5]
The Model (Seat–Vote Curve)
Let (v) be a party’s Vote Share and (s) its Seat Share. In WTA systems, a standard curve is:
Here (k) is responsiveness (closely related to the swing ratio near 50–50). Classic work formalizes this slope and separates responsiveness from bias (tilt at 50–50). Typical two‑party SMD systems show (k) in the 2–4 range. [1, 5]
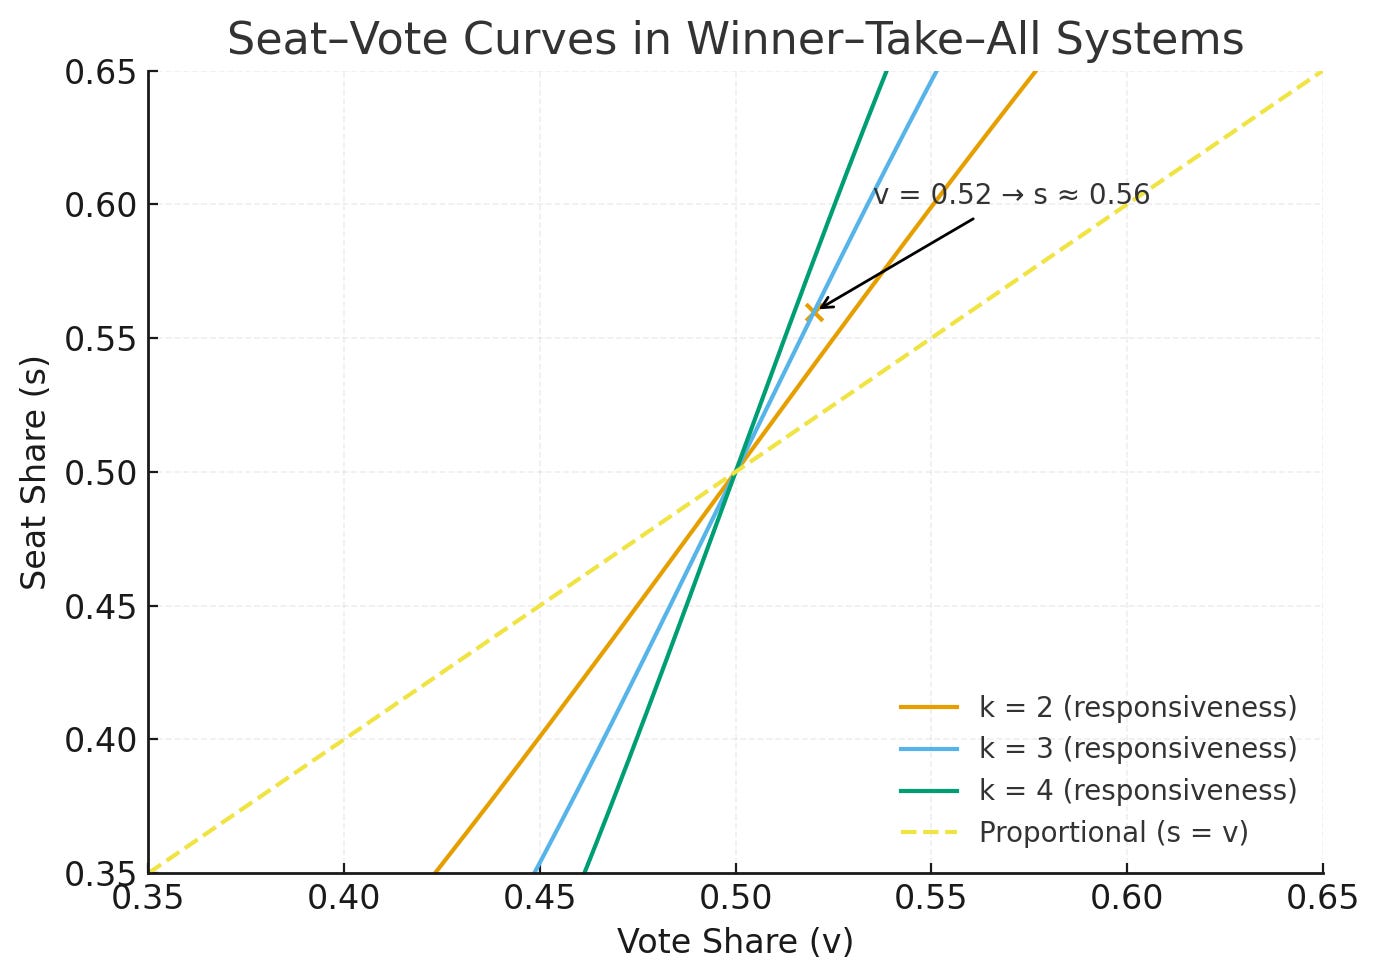
Worked Example. If a party wins 52% of the votes and (k=3),
i.e., ~56% of seats—a 4‑point seat bonus from a 4‑point vote edge. (This is the classic “cube‑law” intuition, updated by modern seats–votes analysis.) [1]
Bias vs. Amplification
Two distinct properties:
Amplification (Responsiveness): Even an unbiased map will magnify small vote edges under WTA.
Bias (Partisan Tilt): If each party had 50% of votes, would each get ~50% of seats? Deviations indicate structural tilt.
Use Partisan Symmetry methods to estimate both the curve’s slope and its intercept at 50%. [2]
Duverger’s Law (Mechanical + Psychological Effects)
Claim. Electoral rules shape party systems. In SMD‑FPTP elections, WTA’s mechanical penalties on third parties induce strategic coordination by voters and elites, yielding two‑party competition. [8, 9]
Mechanical Effect: WTA converts votes to seats in lumpy, winner‑biased ways; third parties suffer severe translation losses (captured by the S‑curve and wasted‑vote logic). [1, 3]
Psychological/Strategic Effect: Anticipating those losses, voters avoid “wasting” votes on trailing options and elites (donors, candidates, media) consolidate behind the top two. [8]
Cox’s M+1 Rule: With M seats per district, up to M+1 serious candidates can persist in equilibrium; under SMD (M=1), competition tends toward two. [9]
Synthesis. The S‑curve is the mechanism; Duverger is the behavioral response to that mechanism. Together they explain stable two‑bloc competition under WTA.
Reform Tie‑Ins
Ranked‑Choice Voting (RCV)/Instant‑Runoff: Reduces “wasted vote” fears by allowing expressive first‑choices with backup rankings; weakens the psychological channel of Duverger while preserving single‑winner districts.
Multi‑Member Districts (MMDs) with STV or low‑magnitude PR: Raise M, relaxing Cox’s M+1 pressure and smoothing the seat–vote mapping so >2 options can stay viable. [12]
Proportional Variants (List PR, MMP): Replace the S‑curve with near‑proportional translation, removing the mechanical penalty that triggers Duverger dynamics. [5, 6]
Wasted Votes (Efficiency Gap)
WTA creates wasted votes—surplus votes beyond what’s needed to win and all votes for losers. The Efficiency Gap summarizes the difference in parties’ wasted votes divided by total votes; persistent gaps capture packing/cracking in one interpretable number. [3]
“Even Without Gerrymandering?”
Yes. Geography alone can yield seat tilts: when one party’s voters are spatially clustered (e.g., dense cities), neutral redistricting ensembles frequently produce lopsided seat outcomes from close vote totals—demonstrating amplification without intent. [4]
Quick How‑To (Replicable Check)
Collect district‑level results for a chamber.
Fit a seats–votes curve (or logistic aggregate swing) to estimate (k) and the 50–50 seat share. [7]
Assess bias (seat share at 50%) and responsiveness (slope near 50%). [2]
Compute the Efficiency Gap from wasted votes. [3]
(Optional) Simulate neutral district plans to see whether geography alone produces similar amplification. [4]
Sources & Further Reading
[1] Tufte, E. R. (1973). The Relationship Between Seats and Votes in Two‑Party Systems. American Political Science Review, 67(2): 540–554.
[2] Gelman, A., & King, G. (1994). Enhancing Democracy Through Legislative Redistricting. American Political Science Review, 88(3): 541–559.
[3] Stephanopoulos, N. O., & McGhee, E. M. (2015). Partisan Gerrymandering and the Efficiency Gap. University of Chicago Law Review, 82: 831–900.
[4] Chen, J., & Rodden, J. (2013). Unintentional Gerrymandering: Political Geography and Electoral Bias in Legislatures. Quarterly Journal of Political Science, 8(3): 239–269.
[5] Taagepera, R., & Shugart, M. S. (1989). Seats and Votes: The Effects and Determinants of Electoral Systems. Yale University Press.
[6] Taagepera, R., & Shugart, M. S. (2017). Votes from Seats: Logical Models of Electoral Systems. Cambridge University Press.
[7] MGGG Redistricting Lab (2019). Implementing Partisan Symmetry: Problems and Paradoxes. Methodological note and code guidance.
[8] Duverger, M. (1954). Political Parties: Their Organization and Activity in the Modern State. Wiley.
[9] Cox, G. W. (1997). Making Votes Count: Strategic Coordination in the World’s Electoral Systems. Cambridge University Press.
[10] Riker, W. H. (1982). “The Two‑Party System and Duverger’s Law: An Essay on the History of Political Science.” American Political Science Review 76(4): 753–766.
[11] Blais, A., & Carty, R. K. (1991). “The Psychological Impact of Electoral Laws: Measuring Duverger’s Elusive Effect.” British Journal of Political Science 21(1): 79–93.
[12] Carey, J. M., & Hix, S. (2011). “The Electoral Sweet Spot: Low‑Magnitude Proportional Systems.” APSR 105(2): 295–310.
Methods/Limits: The responsiveness parameter k is empirically estimated and varies by chamber and era; partisan-symmetry and efficiency-gap metrics depend on modeling choices (e.g., uniform swing, turnout, thresholds) and can behave oddly in edge cases; and redistricting simulations reflect their input constraints and geographic assumptions – so treat results as evidence-based diagnostics, not universal constants.
Researched with AI assistance—which means this document improves as readers verify and correct. Find an error? Let me know. This is living documentation.